Every COO and CFO at a mid-market OEM has seen the same spreadsheet. The offshore unit price looks clean, the labor savings look compelling, and the decision seems straightforward. Then reality shows up: a tariff invoice that wasn’t in the model, a container sitting at port for three weeks, or a field failure traced back to a quality escape that went undetected 7,000 miles away. The cost tradeoffs of onshoring electronics manufacturing in the U.S. are genuinely complex, but most companies are evaluating the decision with an incomplete model.
At Amtech, we’ve walked dozens of OEMs through exactly this analysis over the past several years. The consistent finding is that the gap between offshore sticker price and true total cost is almost always smaller than finance teams expect. In some cases, the apparent offshore advantage can be eliminated entirely once tariff exposure, inventory carrying costs, and quality risk are properly quantified, an outcome well-documented in Reshoring Initiative TCO analyses. This article gives you the full cost picture: every component of a rigorous TCO model, the current tariff context, available U.S. incentives, and a clear framework to make the call for your specific program.
Why the unit price comparison keeps leading OEMs to the wrong answer
The labor cost differential between China and the U.S. is real, and nobody is pretending otherwise. Electronics assembly labor in China runs $6.50 to $8.00 per hour in 2026. In the U.S., that figure sits at $39 to $45. That differential does show up in unit cost, and it’s not trivial. But unit cost at the factory gate and total landed cost after freight, duties, insurance, customs brokerage, and carrying costs are not the same number. For many mid-complexity PCBAs, landed cost routinely runs meaningfully higher than the factory-gate quote once freight, duties, and carrying costs are fully loaded, a gap the Reshoring Initiative’s TCO estimator is specifically designed to surface.
What a standard offshore unit price quote ignores entirely is a separate category of costs that are just as real, even when they don’t appear on the CM’s invoice. These costs are real even when they’re invisible on paper: safety stock in transit, 10 to 14 weeks of pipeline inventory carrying charges, quality escapes discovered only after delivery, and engineering time spent managing exceptions from 7,000 miles away. They have dollar figures. A rigorous total cost of ownership (TCO) model surfaces them, and that’s the right tool for a multi-million-dollar supply chain decision.
Cost tradeoffs of onshoring electronics manufacturing in the U.S.: TCO components
The Reshoring Initiative’s TCO estimator accounts for 30 distinct cost and risk factors across acquisition, operations, logistics, quality, and risk categories. Most OEM finance teams are tracking a handful, often five or six. The baseline comparison starts with standard acquisition line items: materials, assembly labor, inbound freight, tooling, and overhead. These show up in a typical RFQ response, but even here the comparison isn’t apples to apples. Offshore quotes routinely exclude tooling amortization, compliance testing, and engineering support, all of which land on the buyer somewhere downstream.
Inventory carrying costs
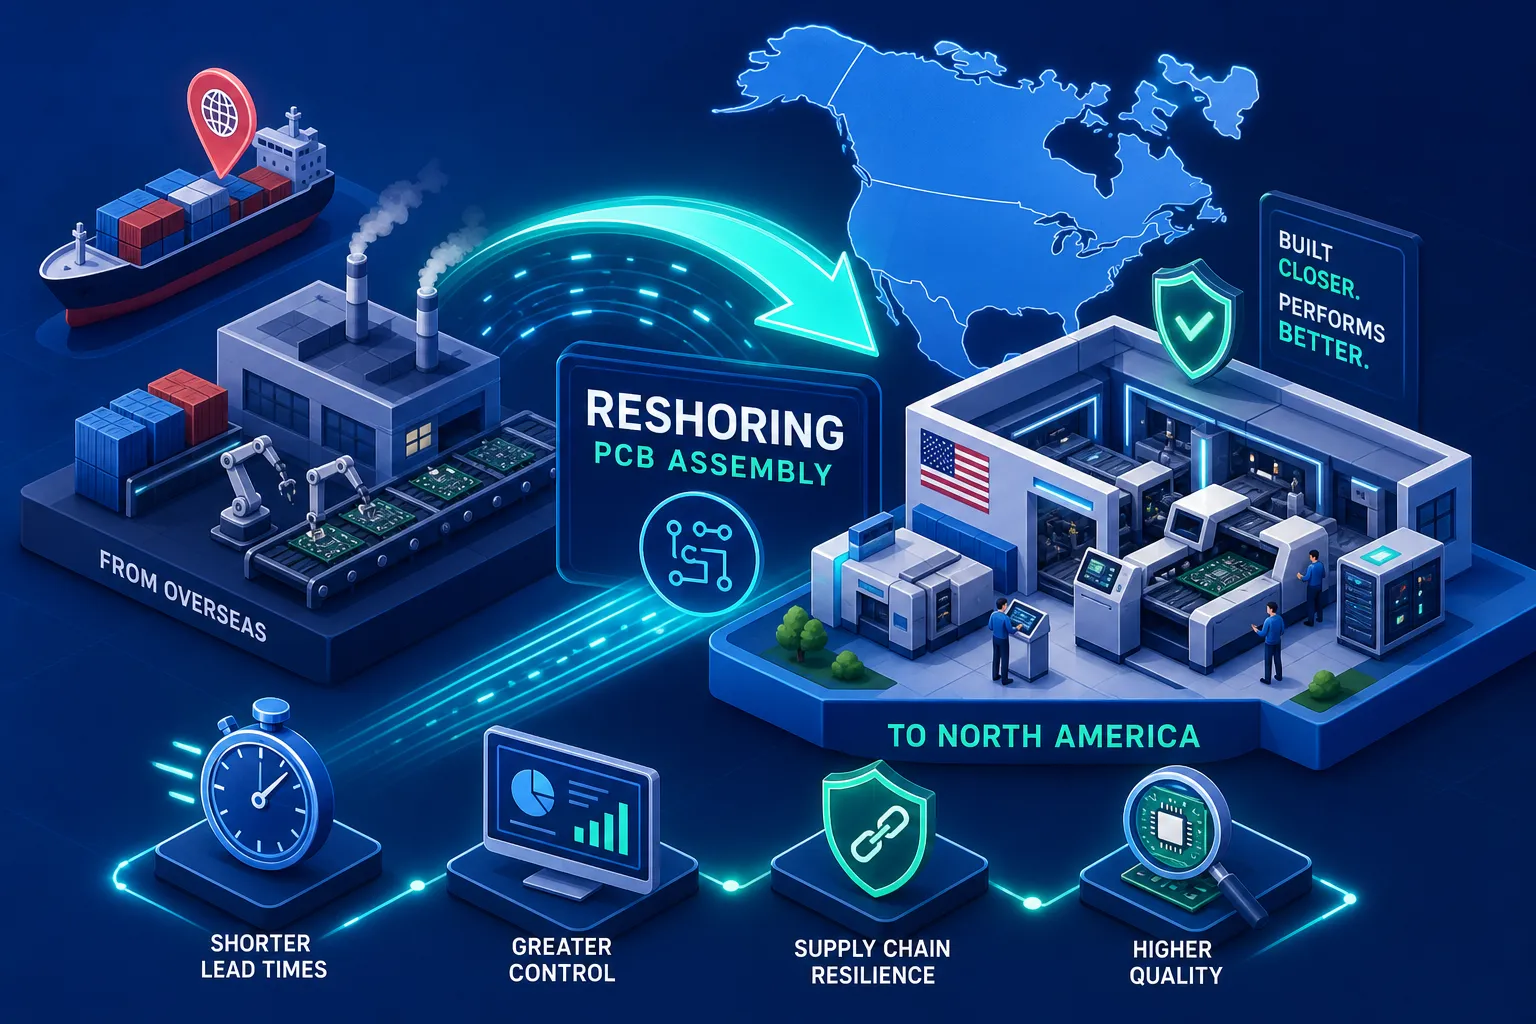
Inventory carrying costs are where the offshore model takes its first significant hit. If a company carries $2 million in offshore work-in-progress and safety stock at a 25% annual carrying rate, consistent with the upper end of the 15% to 25% range commonly used in electronics manufacturing, and higher still for rapidly evolving components, that’s $500,000 per year before a single quality issue surfaces. Domestic production typically delivers significantly shorter lead times than Asia-based suppliers, particularly for prototype and low-to-mid volume runs, which reduces the capital tied up in the pipeline. That reduction is a real dollar figure your model should capture (see inventory carrying cost statistics).
Quality and warranty costs
Quality, rework, and warranty exposure round out the picture. According to Reshoring Initiative research, offshore quality escapes add roughly 12% back to total costs in rework, scrap, incoming inspection, and warranty claims. The discovery lag compounds the damage: offshore defect batches are often identified only after the product lands or fails in service, with corrective action cycles running 6 to 12 weeks. Domestic production with real-time optical inspection and faster feedback loops consistently reduces defect escape rates, and the financial impact of that reduction belongs in any honest cost comparison of onshoring electronics manufacturing in the U.S. The full TCO formula: acquisition costs plus operating costs plus supply chain and logistics costs plus quality and warranty costs plus risk-adjusted costs.
Tariffs and the cost tradeoffs of onshoring electronics manufacturing in the U.S.
Section 301 tariffs on Chinese electronics components were already running 25% to 30% on PCBs and passives before 2025. In early 2025, tariffs on certain semiconductor categories escalated sharply, rising from 50% to 70% in some cases, with only days’ notice between announcement and implementation in several instances. For any product with meaningful semiconductor content sourced from China, those tariffs translate directly into unit cost increases of 15% or more. This isn’t theoretical modeling. It’s showing up on customs invoices right now. For companies evaluating strategies in this environment, our analysis on Reshoring as a Tariff Mitigation Strategy, Amtech is a practical read.
The current effective tariff rate on assembled PCBAs imported from China sits at approximately 35%, composed of the 25% Section 301 tariff, a 10% provisional tariff that took effect in early 2026, and standard HTS duties. For high-value sub-assemblies, total effective rates can reach 40% or higher depending on HTS classification. The landed cost pressure is compounding: surprise post-delivery customs adjustments, extended inspection delays, and retroactive classification shifts are creating a volatile pricing environment that makes offshore BOM costing genuinely difficult to lock down.
When components are sourced domestically or from tariff-exempt regions and assembled in the U.S., the tariff exposure on finished goods and key sub-assemblies disappears from the landed cost calculation. Consider a concrete example: a PCBA with $40 in Chinese-sourced content facing a 35% effective tariff rate carries $14 in tariff cost per board before it reaches your dock. Sourced and assembled domestically, that $14 is gone. For high-volume programs or products with significant semiconductor content, the tariff line item alone can close a substantial portion of the apparent labor cost gap.
U.S. incentives that reduce the onshoring cost gap
Before building your TCO model, it helps to know which incentive programs your program can realistically access, and which are frequently cited but rarely applicable. The CHIPS Act’s $39 billion in manufacturing incentives primarily targets semiconductor fabrication facilities, not general electronics assembly. Section 45X applies to batteries, solar components, and clean energy hardware. Most mid-market OEMs building industrial, IoT, or commercial electronics products won’t qualify for either program directly. What they can realistically access is the federal R&D tax credit, which offsets costs for process improvements, new product development, automation investment, and prototype design. The 2025 change requiring amortization of R&D expenses over five years under Section 174 changed how and when the credit is realized, so build that timing into your financial model. Additionally, policy moves like the Advanced Manufacturing Tax Credit are reshaping the incentive landscape for domestic manufacturing.
State-level programs move the needle more directly for general electronics manufacturers. New Jersey’s Next NJ Manufacturing Program offers up to $150 million in tax credits per project for advanced manufacturing facilities with a minimum $10 million investment and 20 full-time jobs, with bonus incentives for minority, women, and veteran-owned businesses. Rhode Island offers an equipment grant covering 50% of qualified equipment costs up to $25,000, modest but stackable. Georgia provides a job tax credit of $4,000 per job annually, Idaho offers a 3% investment tax credit on qualified manufacturing equipment, and the federal Work Opportunity Tax Credit extends up to $9,600 per eligible hire. State programs vary significantly by sector and facility location, so proactive outreach during production planning is required to capture these credits.
Building a simple breakeven model for your specific product
Populate the TCO formula with your own program data across five cost categories. Acquisition costs: materials, assembly labor, tooling, inbound freight, and setup. Operating costs: overhead, engineering support, compliance testing, and quality assurance. Supply chain costs: freight, tariffs and duties, customs brokerage, and lead time variability. Quality and warranty costs: incoming inspection, rework and scrap, field failure rates, and warranty claims. Risk-adjusted costs: IP exposure, emergency expedite freight, and supplier stability. Run that model for both domestic and offshore scenarios and let the total, not the unit price, drive the comparison.
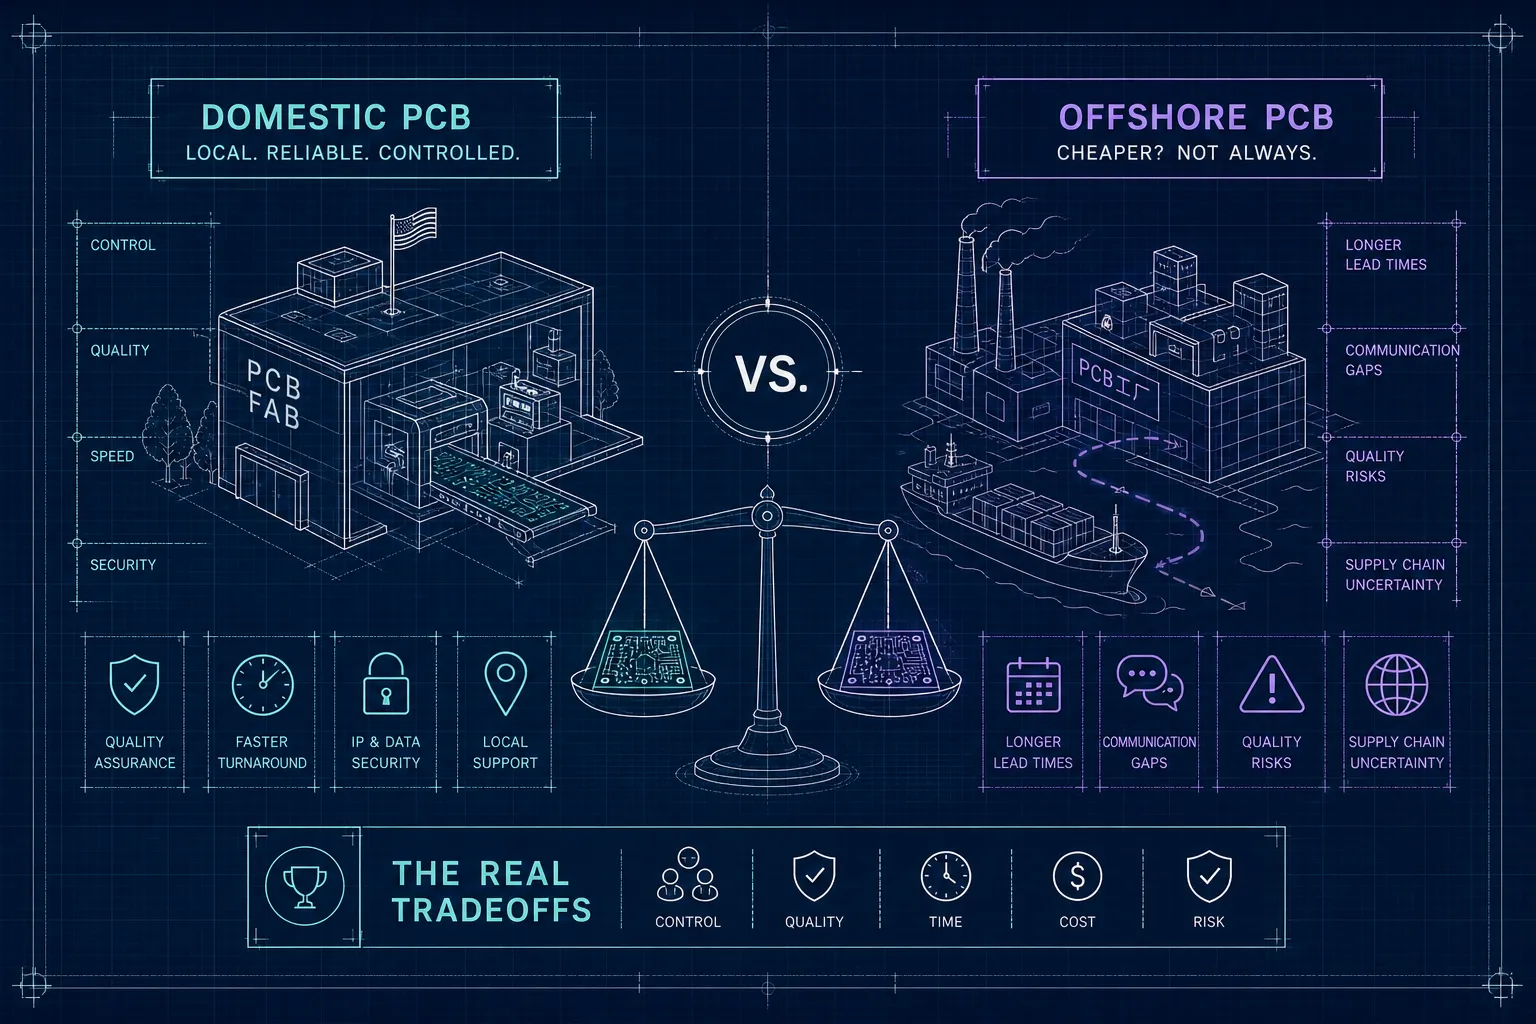
The variables that make domestic production most competitive are predictable. High-mix or frequently revised products see disproportionate offshore costs because tooling changes and engineering iteration are expensive and slow at distance. IP-sensitive designs carry real financial risk in offshore environments, and that risk belongs in the model as a risk-adjusted cost. Products with significant tariff exposure, as outlined above, see the labor cost gap narrow dramatically once landed cost is calculated correctly. Programs where inventory carrying cost is a larger line item than labor, common for companies with seasonal demand patterns or long BOM tails, often tip decisively toward domestic production when the full model is built. For a detailed comparison of onshore versus offshore tradeoffs, see Domestic PCB Production vs. Offshore: The Real Tradeoffs, Amtech.
At Amtech, we work directly with OEM finance and operations teams to build this full TCO model before quoting, specifically to avoid the unit-price-only comparison trap. The output is a structured cost comparison that accounts for every category covered in this article. That analysis gives leadership the defensible data needed to make or defer the reshoring decision with confidence, rather than acting on incomplete information under time pressure.
How to make the final call: onshore, nearshore, or stay offshore
Onshoring makes the strongest case for high-mix, low-to-mid volume programs with significant tariff exposure, IP-sensitive content, or frequent engineering changes. If your product is revised every 6 to 18 months, if your BOM carries meaningful Chinese-sourced semiconductor content, or if defect escape costs and warranty risk are significant, domestic production is almost certainly closer to cost parity than your current model suggests. These are the programs where the labor cost differential gets absorbed by other line items in the TCO.
Nearshoring through Mexico provides a middle path: labor costs of $4.82 to $6.50 per hour, tariff-free access to the U.S. market under USMCA (subject to applicable rules of origin), and lead times faster than Asia. It’s well-suited for higher-volume, stable designs where the BOM is light on Chinese semiconductor content and engineering changes are infrequent. Offshore production in China or Vietnam remains defensible for commodity, high-volume, price-sensitive products with stable BOMs, low tariff exposure, and limited IP risk. The key word there is defensible: run the full model before concluding that it’s cheaper, because most companies making that assumption haven’t priced in carrying costs, tariff exposure, and quality risk correctly. For additional context on the shifting affordability of China manufacturing, see Is China still the most affordable option for manufacturing?
In our experience at Amtech, many OEMs reach this decision point and stall because they don’t have a manufacturing partner willing to build the full model with them. The right next step is a structured TCO analysis with a domestic CM that has already onshored comparable programs and understands what each cost category actually shifts by. If your organization is within 18 months of a sourcing review or contract renewal with an offshore partner, now is the right time to run that analysis. The unit price comparison is the wrong tool for this decision. The full model is not that much harder to build, and the output is a number you can defend to your board.
The decision you can actually make with confidence
The cost tradeoffs of onshoring electronics manufacturing in the U.S. are real, calculable, and almost always more favorable than the unit price comparison suggests. Tariff exposure, inventory carrying costs, quality escape rates, and lead time risk frequently close the apparent labor cost gap by a larger margin than most finance teams expect when they first look at the offshore sticker price. That doesn’t mean onshoring wins every comparison. It means the comparison has to be complete.
Amtech builds that analysis alongside customers, starting from wherever they are in the product lifecycle. Whether you’re evaluating a first onshoring move, stress-testing an existing offshore relationship against current tariff exposure, or planning a production ramp that needs to be cost-competitive at scale, the TCO model is the right place to start. You have the full set of cost components, the TCO formula, the current tariff context, and the incentive landscape to structure that analysis for your specific product, the next step is putting real numbers from your program into the model. Reach out to our team and we’ll build it with you. Learn more about our approach on On/Re-Shoring, Amtech.